


The slowness of Prestashop can come from several problems that you will have to identify.
Before starting, you need to know why you think your Prestashop is slow. Indeed, if it's because it has a bad score on tools like Google's Pagespeed Insights or GTMetrix then you should read our article on this specific subject: Understand and improve the Pagespeed score of your Prestashop store . If on the contrary it is a general slowness of the store, and even on the backoffice, then it is surely that your Prestashop has response times too long, we will talk about TTFB (Time To First Byte) too slow. This article will help you to identify this TTFB problem.
Check the settings of the Prestashop Performance page
The first thing to do is to go to the Prestashop performance configuration in the "Advanced Settings" menu then "Performance". Then check them with our article "The correct settings to improve Prestashop Performances ".
Remove unnecessary modules
Prestashop comes with a lot of modules by default and some of them are useless or redundant. For example, if you are using Google Analytics you probably don't need the many statistics modules.
Don't hesitate to go through the list of your modules and ask yourself for each of them if it is really necessary or not.
Do a profiling
Profiling is the measurement of several data during the generation of a page. On Prestashop you can measure the time spent, the memory consumed, the SQL queries executed, etc. during the generation of product pages, categories, homepage, etc. but also on the backoffice side for the administration of the store. Indeed, the loading of pages can also be slow on the back-office side and it is important to optimize them to spend less time managing your store (and not go crazy because it is slow!).
SQL Profiling
I start with SQL profiling because it proves to be the most effective. Indeed, the majority of slowdowns are typically caused by poorly optimized SQL queries. Slowdowns attributable to PHP code are rare unless it involves processing a long list of files.
Prestashop offers a "profiling" mode that I will detail in the following section. However, this mode is not entirely satisfactory because it merely generates a significant "dump" of data directly on the displayed pages and cannot be activated for Ajax requests.
Therefore, I have developed a module that records all queries sent to the MySQL server, analyzes them, and organizes them to provide you with a detailed report, highlighting suspicious queries that deserve your attention. I have already tested it with several clients who were experiencing slowdowns on their Prestashop store, and the module immediately identified the cause of the slowdown.
The module can be used in production because its impact on visitors is negligible. Indeed, profiling is only active for the administrator who activates it.
This functionality is integrated into module Speed Pack (Page Cache Ultimate + WEBP/AVIF + SQL Profiling + Doctor PRO) but is also available as an independent module: SQL Profiler .
Profiling integrated in Prestashop
To enable profiling, change the constant _PS_DEBUG_PROFILING_ in the /config/defines.inc.php file.
If the store is open to customers you can activate the tool only for you by specifying your IP like this:
define('_PS_DEBUG_PROFILING_', $_SERVER['REMOTE_ADDR'] == '37.123.456.789');
You can find out your IP on https://www.whatsmyip.org/
Once profiling is activated you will see several tables displayed on all pages on the back-office and front-office sides. Let's go through all this data together:
- Loading time: this is the TTFB, if it is greater than 1 second (1000ms) then this confirms a long TTFB problem
- Querying time: if it is more than 50% of the "Loading time" it means that you have a SQL query that is too slow or executed too many times or that your database server is not powerful enough.
- Queries: this is the number of SQL queries executed, don't be afraid, on Prestashop it's huge!
I won't detail everything, only the important data.
You will also find a table with the columns "Time", "Cumulated Time", "Memory Usage" and "Memory Peak Usage" and the following lines:
- config: this represents the loading of the Prestashop CMS, if it is very slow here then your server is not powerful enough or is badly configured
- _construct: time spent in the controller constructor
- init: time spent in the init() method of the controller
- checkAccess: time spent in the controller's checkAccess() method which allows to check the permissions, normally at 0 (or very very short)
- setMedia: time spent in the setMedia() method of the controller that allows to add CSS or javascript files, normally very very short
- postProcess: time spent in the postProcess() method of the controller which allows to save the data of a form. Can be long depending on the form and the processing to be done. Must be 0 on a classic display page like products, categories, etc.
- initHeader: time spent in the initHeader() method of the controller. This is where the data to be displayed is retrieved, although this is often done in the initContent() method.
- initContent: time spent in the initContent() method of the controller. This is where the 'displayHeader' hook of the modules is called as well as most of the processing that will generate the content of the web page.
- initFooter: time spent in the initFooter() method of the controller. Often empty because few controllers do processing here.
- display: time spent in the display() method of the controller. This is the time taken by Smarty to render the page, in other words the time spent compiling the templates and populating the values. If the time is long it means that you may have forgotten to activate Smarty's cache or that there are really a lot of elements to display. It can also be a module or a widget that is very slow in one of its hooks.
Unfortunately in PS1.7 there is no more information about the execution of modules and hooks, a Pull Request #20673 has been closed but I don't know in which version it will be merged. In the meantime, if you have Page Cache Ultimate you can find this data in the built-in profiling tool.
The table"Stopwatch SQL - xxx queries" lists all executed SQL queries, from the slowest to the fastest. Personally I consider a query that exceeds 100ms to be slow. However, if the order of magnitude of the times is the same, i.e. a single query does not stand out from the others by its slowness, then it is perhaps the MySQL server that is not performing well enough.
Profiling provided by the Page Cache Ultimate module
Our module Page Cache Ultimate (également intégré au module Speed Pack (Page Cache Ultimate + WEBP/AVIF + SQL Profiling + Doctor PRO) ) provides a tool to measure the time spent by each module in each hook. The procedure to analyze the slowness of a web page is as follows:
- enable profiling in the Page Cache Ultimate configuration page
- empty the profiling data
- display the slow web page
- refresh the data table and sort it by "duration", from largest to smallest
If a module is much slower than the others it is probably the culprit, in this case the solution is to contact the developer and ask him to optimize the loading speed of this one. If you see several slow modules it is possible that the problem is related to the power of the Apache server or the database server (MySQL or MariaDb).
Check the power of your hosting
If there are no suspects or clues from the profiling and the slowness is generalized, then your server may not be configured correctly or it may not be powerful enough.
PHP version
Start by checking if the PHP version is correct. Look at this table to know which PHP version you should have at least depending on the version of Prestashop:
| PHP version | |||||||||||||||
|---|---|---|---|---|---|---|---|---|---|---|---|---|---|---|---|
| PrestaShop version | ≤5.1 | 5.2 | 5.3 | 5.4 | 5.5 | 5.6 | 7.0 | 7.1 | 7.2 | 7.3 | 7.4 | 8.0 | 8.1 | 8.2 | ≥8.3 |
| PS 1.6.1.x | No | Yes | Yes | Yes | Yes | Yes | Yes | Recommended version | No | No | No | No | No | No | No |
| PS 1.7.0 ~ PS 1.7.3 | No | No | No | Yes | Yes | Yes | Yes | Recommended version | No | No | No | No | No | No | No |
| PS 1.7.4 | No | No | No | No | No | Yes | Yes | Recommended version | No | No | No | No | No | No | No |
| PS 1.7.5 ~ PS 1.7.6 | No | No | No | No | No | Yes | Yes | Yes | Recommended version | No | No | No | No | No | No |
| PS 1.7.7 | No | No | No | No | No | No | No | Yes | Yes | Recommended version | No | No | No | No | No |
| PS 1.7.8 | No | No | No | No | No | No | No | Yes | Yes | Yes | Recommended version | No | No | No | No |
| PS 8.0 ~PS 8.2 | No | No | No | No | No | No | No | No | Yes | Yes | Yes | Yes | Recommended version | No | No |
| PS 9 | No | No | No | No | No | No | No | No | No | No | No | No | Yes | Yes | Recommended version |
Legend: = Recommended version, Yes = Supported, No = Not supported
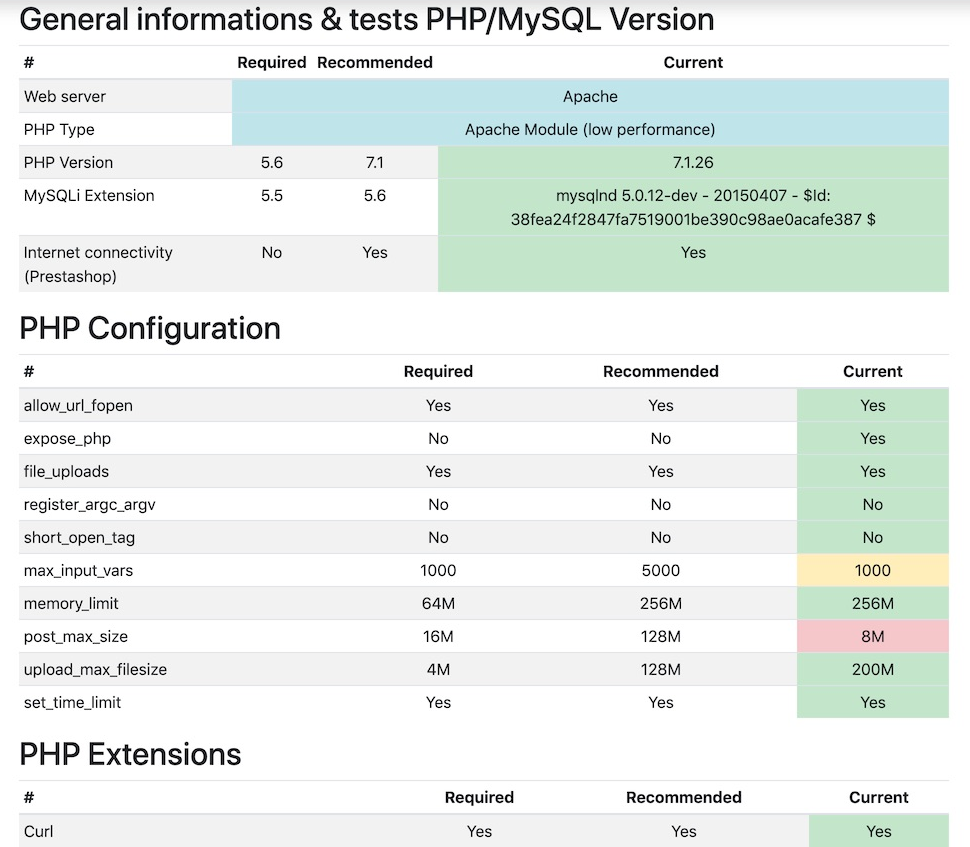
PHP settings and extensions
You can also use this PHP script to check if your Apache server is configured correctly for Prestashop. It will check the essential settings and extensions for the CMS:
Conclusion
If after all these tests and corrections your TTFB remains very long, more than 1 second, you should consider taking a more powerful hosting package or install our HTML cache module Page Cache Ultimate .
In any case I wish you good luck and I hope you will solve your performance problems with Prestashop quickly!
Leave a comment